
Mastering VWAP & Anchored VWAP: The Institutional Benchmark for Day & Swing Traders
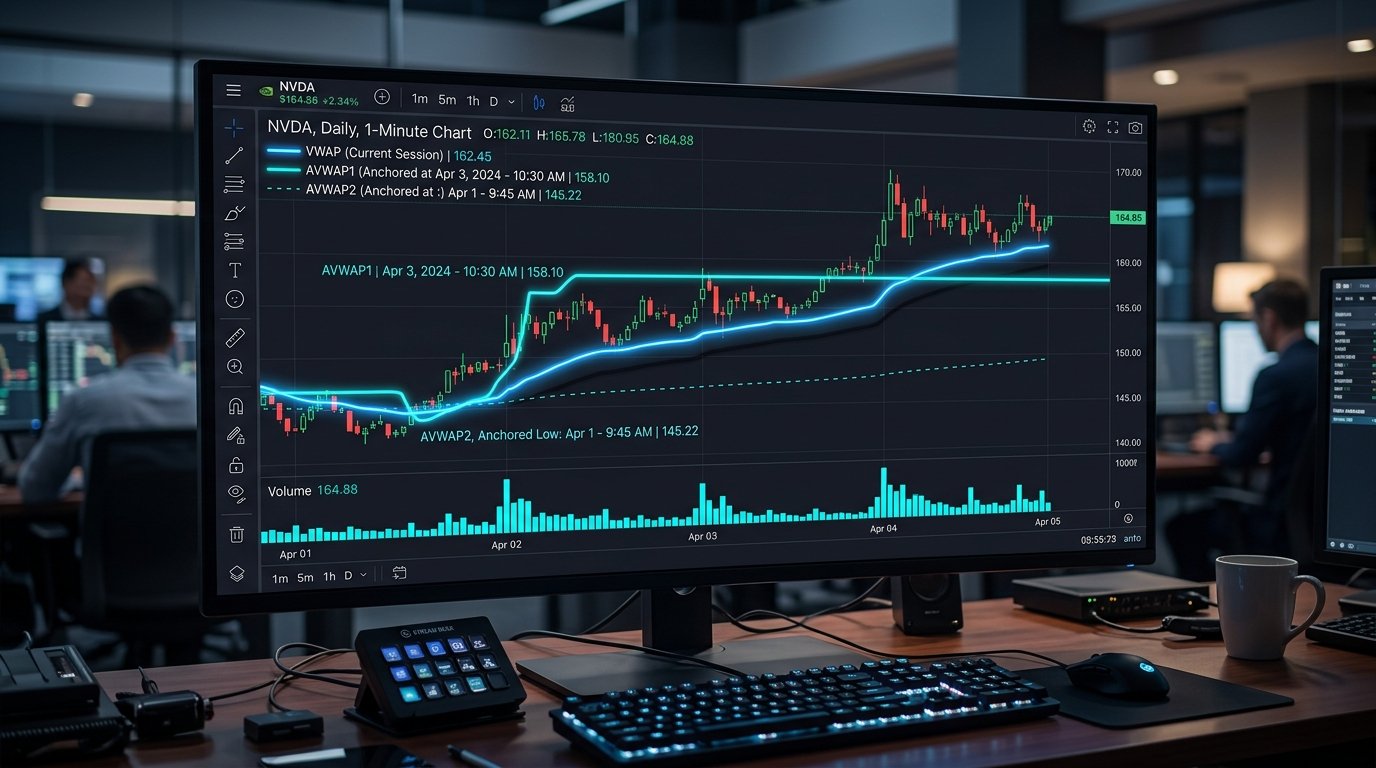
Table of Contents
Most retail technical indicators (like simple moving averages) treat every price bar equally regardless of transaction volume. Volume Weighted Average Price (VWAP), by contrast, weights every price point by the exact volume executed at that price during a specific trading period.
Because institutional asset managers, pension funds, and algorithmic execution algorithms use VWAP as their primary performance benchmark, price consistently reacts to VWAP levels with high mathematical precision.
How VWAP is Calculated
VWAP calculates the cumulative true average price of a security weighted by total volume traded throughout a session.
Standard VWAP vs. Anchored VWAP (AVWAP) vs. Moving Averages
While standard session VWAP resets every morning at market open (9:15 AM IST), Anchored VWAP (AVWAP) allows traders to anchor the cumulative volume-weighted calculation to any significant market event in history.
| Feature | Standard Session VWAP | Anchored VWAP (AVWAP) | Moving Average (EMA/SMA) |
|---|---|---|---|
| Reset Trigger | Daily Market Open | Custom Event (Earnings, Lows, Gaps) | Continuous rolling period |
| Volume Weighting | Yes (True volume weight) | Yes (True volume weight) | No (Unweighted price average) |
| Primary Use Case | Intraday Scalping & Momentum | Swing Trading & Major Trend Levels | Trend Following & Crossovers |
| Institutional Relevance | High (Daily execution) | Very High (Event-driven positions) | Medium |
3 Key Events to Anchor VWAP For Swing Trading
- Earnings Announcement Days: Anchoring AVWAP to the market open after earnings reveals the average price paid by big players since the news release.
- Major Swing Highs / Swing Lows: Anchoring to absolute market bottoms or tops identifies where buyers or sellers took full control of market structure.
- High-Volume Gap Days: Gaps backed by multi-month high volume create definitive support/resistance zones that remain active for months.
VWAP Standard Deviation Bands & Mean Reversion
Adding Standard Deviation Bands (+1, +2, -1, -2) around the VWAP line creates a dynamic volatility envelope:
- Inside : Normal value area where ~68% of price action occurs.
- Outside : Overextended condition. Prices trading above are statistical candidates for mean-reversion pullbacks back toward VWAP.
The VWAP Pullback Trading Setup: 5-Step Execution Protocol
When a stock is in a strong trend above its daily VWAP, aggressive chasing leads to poor risk-reward ratios. Instead, wait for price to test the VWAP line:
- Trend Confirmation: Ensure the stock is making higher highs and higher lows on the 15-minute timeframe.
- First Touch Pullback: Look for a rejection candlestick (such as a hammer or bullish engulfing) touching the VWAP or -1 band.
- Volume Spike Confirmation: Confirm that volume surges as buyers defend the VWAP line.
- Risk Parameter: Place stop-loss 0.3% below the VWAP line or recent swing low.
- Target: Target a minimum 1:2 Risk-to-Reward ratio or the +2 upper band.
Related Journal Articles
Mastering Price Action Breakouts: Identifying Valid vs. False Breakouts
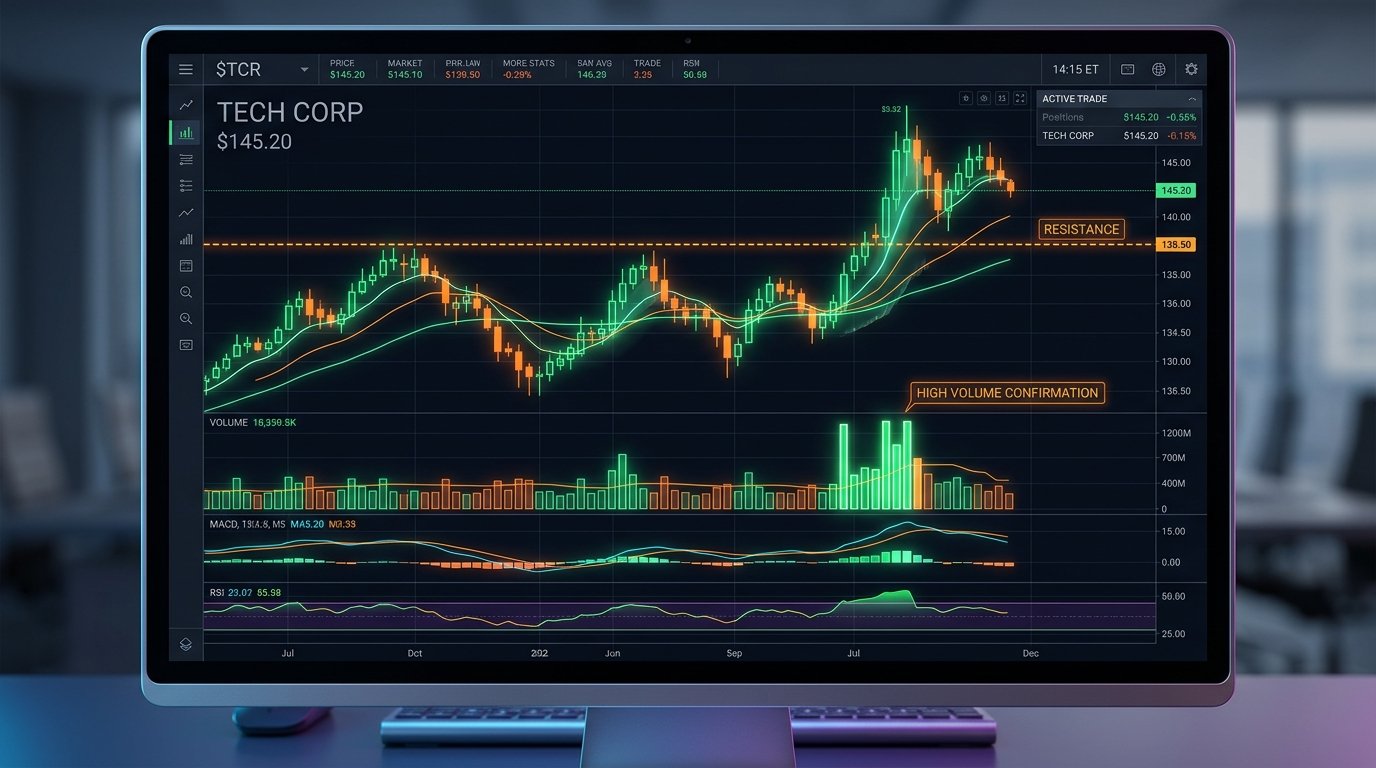
Breakout trading yields massive risk-reward ratios when confirmed by institutional volume and market structure. Learn how to filter out bull and bear traps using 4 confirmation rules.
Understanding Price Action: Reading Japanese Candlesticks with Context
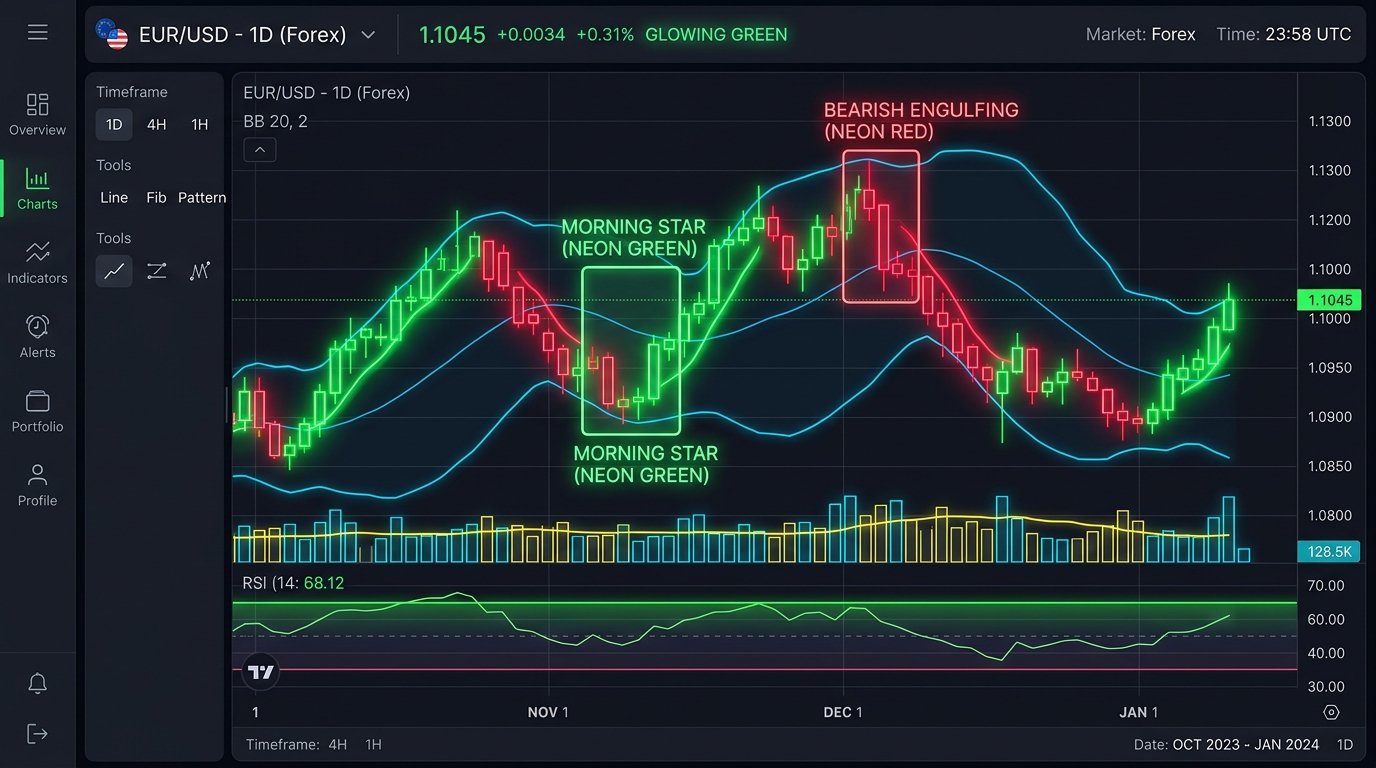
Candlestick patterns are not magic signals. Discover how to interpret price action in structural context — support/resistance zones, trend direction, volume confirmation, and liquidity sweeps.