
Mastering Price Action Breakouts: Identifying Valid vs. False Breakouts
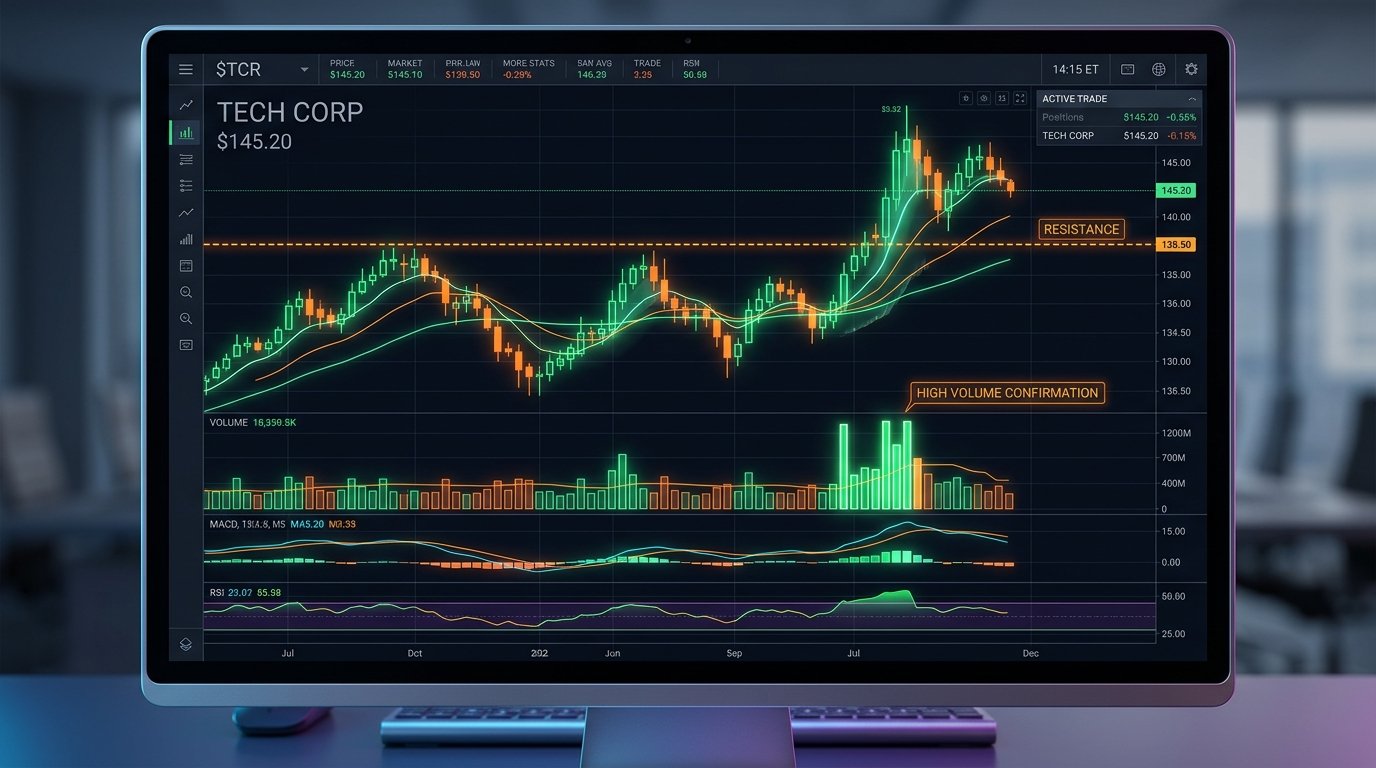
Table of Contents
Breakout trading is one of the most lucrative technical analysis strategies in momentum markets. However, retail traders frequently fall into false breakouts (bull and bear traps), where price momentarily pierces a key support or resistance level only to sharply reverse in the opposite direction.
To trade breakouts with statistical consistency, you must distinguish between genuine institutional accumulation and low-volume retail traps.
Valid Breakout vs. False Breakout Comparison
| Metric / Characteristic | Valid High-Probability Breakout | False Breakout (Bull/Bear Trap) |
|---|---|---|
| Volume Behavior | 2x to 3x Average Daily Volume on breakout candle | Below average or declining volume |
| Pre-Breakout Base | Tight consolidation (Volatility Contraction / VCP) | Extended vertical rally without basing |
| Candle Closure | Strong full-bodied candle closing near session high | Upper wick rejection with body closing inside range |
| Market Context | Aligned with major index sector momentum | Divergent from broader market trend |
| Post-Breakout Retest | Low-volume pullback holding above previous resistance | Immediate sharp breakdown back into previous range |
Measuring Volume Confirmation
To verify institutional participation during a breakout, calculate the Volume Expansion Ratio:
4 Rules to Confirm a High-Probability Breakout
1. Look for Volatility Contraction Patterns (VCP)
A stock that consolidates tightly near resistance—forming narrower price swings over several weeks—demonstrates that sellers are running out of inventory. A breakout from a VCP pattern carries an 80%+ success rate.
2. Require a Session Close Beyond Resistance
Never enter a breakout trade mid-session before the daily or 4-hour candle closes. Premature entries expose you to intraday shadow wicks where prices collapse before the closing bell.
3. The Retest Entry Technique
If you miss the initial breakout candle, wait for the first low-volume pullback to test the broken resistance line (now serving as new support).
- Entry: Buy on a bullish reversal candle at the retest level.
- Stop Loss: Place stop loss 0.5% below the retest swing low.
- Risk-Reward Target: Minimum 1:3 Risk-to-Reward ratio.
4. Advanced Trailing Stop Loss Technique
Once a breakout trade moves into profit, trail your stop loss behind the 20-day Exponential Moving Average (20 EMA) or lower swing lows. This allows you to ride massive multi-week momentum trends while protecting gains.
Related Journal Articles
Understanding Price Action: Reading Japanese Candlesticks with Context
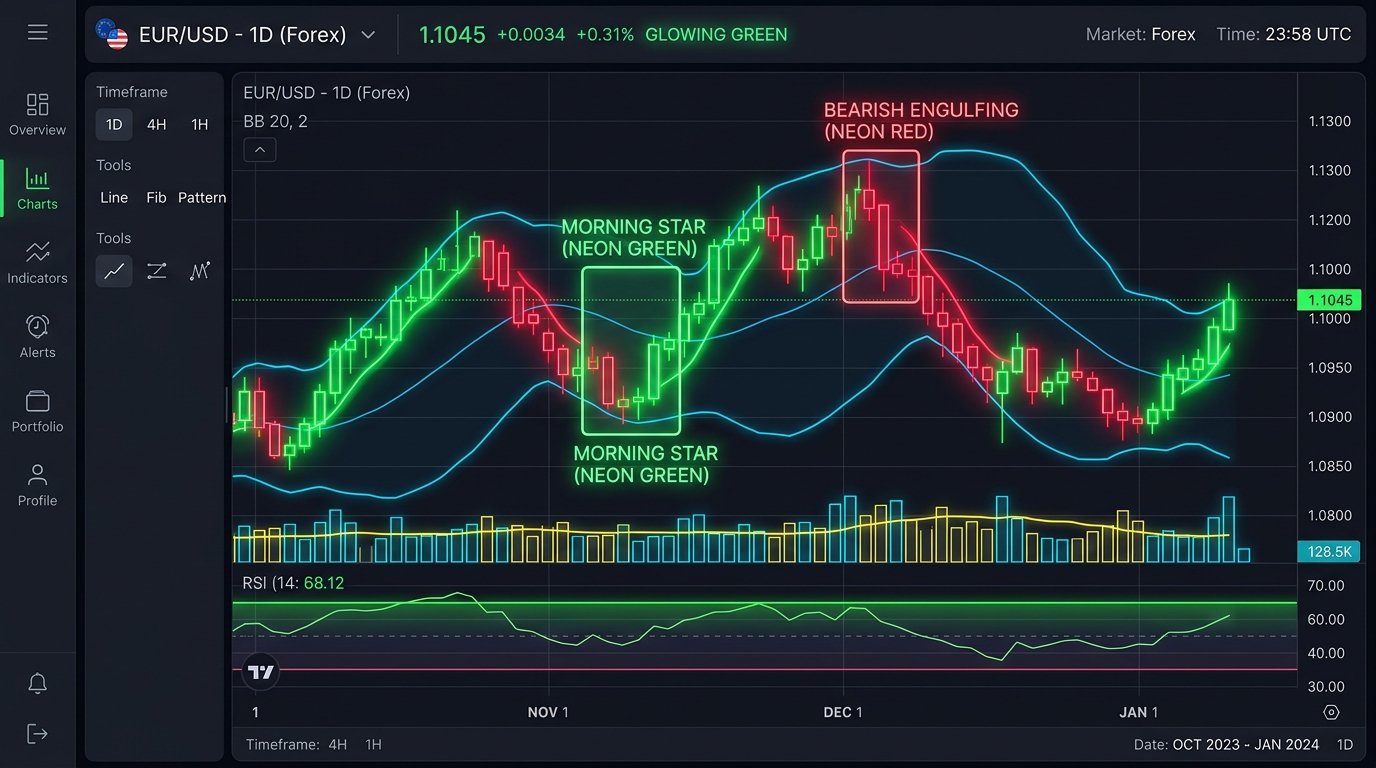
Candlestick patterns are not magic signals. Discover how to interpret price action in structural context — support/resistance zones, trend direction, volume confirmation, and liquidity sweeps.

Overcoming Loss Aversion & Revenge Trading: The Neuroscience of Discipline
Why losses hurt twice as much as gains feel good. Master psychological circuit breakers, risk-per-trade caps, and neuroscience routines to eliminate revenge trading.