
Understanding Price Action: Reading Japanese Candlesticks with Context
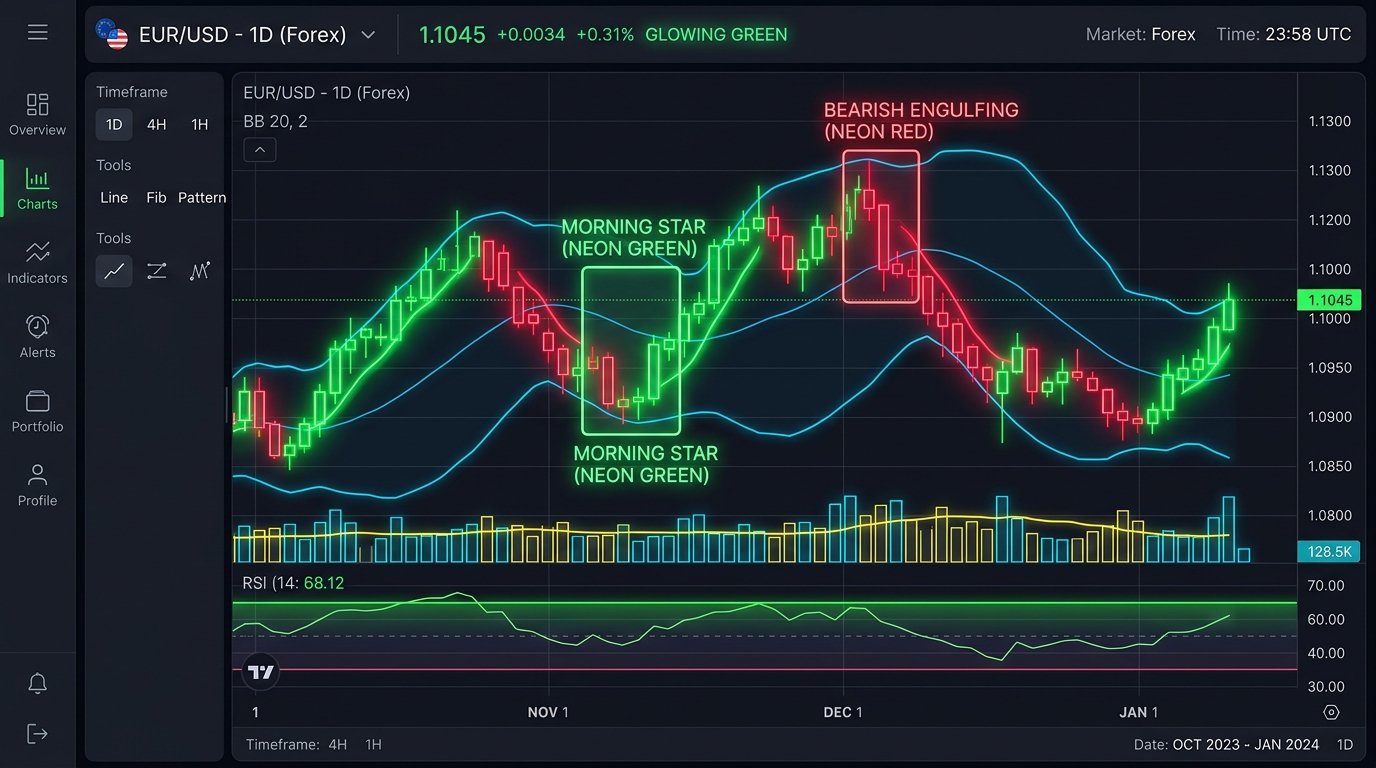
Table of Contents
A common beginner mistake in technical analysis is treating Japanese candlestick patterns (like hammers, pin bars, engulfing candles, or dojis) as automatic buy or sell triggers in isolation. Memorizing 50 different candlestick shapes without understanding the underlying auction market dynamics inevitably leads to frustrating losses and over-trading.
Japanese candlesticks are simply visual representations of the constant tug-of-war between aggressive buyers (bulls) and aggressive sellers (bears). When evaluated at key structural chart levels with volume confirmation, candlesticks reveal the footprint of institutional order flow.
Anatomy of a Candlestick & Auction Mechanics
Each candlestick compresses four critical price points into a visual story of market sentiment over a specific time horizon:
- Open Price: The initial balance of supply and demand when the candle period opens.
- High Price: The absolute peak level buyers were able to push price before supply absorbed demand.
- Low Price: The lowest level sellers pressed price before demand stepped in to halt the decline.
- Close Price: The final agreement price at the end of the session—the most important data point for institutional valuation.
Understanding Wicks vs. Real Bodies
- Wide Real Body: Demonstrates strong directional conviction and aggressive institutional participation.
- Long Wicks (Shadows): Indicate price rejection and liquidity sweeps. A long upper shadow shows that buyers attempted to push price higher but were aggressively met with institutional selling supply.
Core High-Probability Reversal Formations
1. The Pin Bar (Hammer & Shooting Star)
A valid pin bar features a small real body positioned at one extreme end of the candle range, accompanied by a long tail (wick) at least two to three times the length of the real body.
- Bullish Pin Bar (Hammer): Long lower shadow showing a sharp rejection of lower prices at key support.
- Bearish Pin Bar (Shooting Star): Long upper shadow signaling intense overhead selling pressure at resistance.
2. Engulfing Formations
An engulfing pattern signals a decisive shift in market dominance from one group of market participants to another:
| Pattern Type | First Candle | Second Candle | Ideal Structural Context |
|---|---|---|---|
| Bullish Engulfing | Small Bearish Body | Large Bullish Body completely covering 1st body | Demand Zone / Major Swing Low / 200 EMA |
| Bearish Engulfing | Small Bullish Body | Large Bearish Body completely covering 1st body | Supply Zone / Major Swing High / Trendline |
| Inside Bar (Harami) | Large Trend Body | Small Body contained entirely within 1st candle | Consolidation before explosive breakout |
| Tweezer Bottom | Bearish Candle | Bullish Candle matching exact same low price | Double bottom rejection on intraday charts |
Volume-Spread Analysis (VSA) & Candlestick Confirmation
Candlestick shapes become significantly more predictive when combined with Volume-Spread Analysis (VSA):
- High Volume + Wide Body Candle: Confirms genuine institutional push. Price is likely to continue in the direction of the breakout.
- High Volume + Long Wick Candle: Signals massive absorption. Institutional limit orders are absorbing market orders, signaling an imminent reversal.
- Low Volume + Breakout Candle: Warning sign of a false breakout (bull or bear trap). Lack of institutional volume means price will likely return inside the previous consolidation range.
Multi-Timeframe Alignment: Top-Down Analysis
To maximize your win rate, never trade candlestick patterns in isolation on lower timeframes without higher timeframe context:
- Daily / Weekly Chart: Identify the primary trend direction and mark key horizontal Support/Resistance zones.
- 4-Hour / 1-Hour Chart: Monitor price structure as it approaches your daily levels. Look for momentum deceleration (smaller candle bodies).
- 15-Minute / 5-Minute Chart: Wait for a high-volume reversal candlestick (Pin Bar or Engulfing) aligned with the higher timeframe trend to trigger your trade.
The Trader Mind Forge 3-Filter Confluence Rule
At Trader Mind Forge, we teach our students never to place a trade on pattern recognition alone. Every trade setup must pass three strict confluence checks:
- Key Level Alignment: Is the setup occurring at a major Support/Resistance line, 50/200 EMA, or Anchored VWAP level?
- Higher Timeframe Trend: Is the signal aligned with the weekly and daily market structure?
- Volume & R:R Confirmation: Did volume surge on the signal candle, and does the setup provide at least a 1:2 Risk-to-Reward ratio?
Related Journal Articles
Mastering Price Action Breakouts: Identifying Valid vs. False Breakouts
Breakout trading yields massive risk-reward ratios when confirmed by institutional volume and market structure. Learn how to filter out bull and bear traps using 4 confirmation rules.

Mastering VWAP & Anchored VWAP: The Institutional Benchmark for Day & Swing Traders
Discover how institutional algorithms use Volume Weighted Average Price (VWAP) and Anchored VWAP (AVWAP) to execute large orders, and how retail traders can align with institutional supply and demand.